The 2015 CAL-ACCESS challenge
Four ways to dig deeper into California campaign cash at this week’s Stanford symposium, Corruption: Who plays, who pays?
Who is bankrolling the most powerful politicians in America’s largest state? What are special interests lobbying to stuff in California’s $150 billion budget?
Despite a complex and costly set of regulations, there’s no easy answer. Basic facts and figures are buried deep within an arcane state database, known as CAL-ACCESS, that records the millions of dollars in campaign contributions and lobbying activity that oil the Sacramento statehouse.
In a little-noted landmark, California yielded to a flurry of pressure in 2014 and for the first time officials posted a free download of the system’s raw data, updated daily.
The newly released information has created an unprecedented opportunity to analyze money in state politics. But it remains unrealized.
Sprawling across 76 database tables and weighing in at more than 650 megabytes, a significant effort is required to understand the dump’s esoteric structure and prepare the records for meaningful analysis.
That project is already underway. Under the new banner of the California Civic Data Coalition, news developers at the Stanford Computational Journalism Lab, the Bay Area’s Center for Investigative Reporting and the Los Angeles Times Data Desk are collaborating to automate away the database’s difficulties.

We’ve released a first-generation of open-source tools that begin the work of downloading and decoding the data. In a series of code convenings, more than 50 developers, representing dozens of different news organizations, have contributed code to start building a foundation for future analysts.
Now we need you. We’re looking for developers, data scientists and campaign finance experts to help us advance our cause.
Below are a series of challenges for the afternoon workshops scheduled for Friday April 17, following Stanford’s symposium on money in politics. The Thursday symposium is open to the public.
We’re hoping your expertise can uncover ways to make advanced analysis easier. Whether you’re at the Stanford event or not, we welcome your contributions. Dozens more tasks, of varying size, can be found in our open-source repositories on GitHub.
Challenge #1: Automate the standardization of campaign donors

There is no master list of the people who fund California’s political campaigns, only the jumbled, misshapen and sometimes deliberately obscured data punched into the disclosure forms required by state law.
For instance, Charles Munger Jr., a top backer of California’s Republican Party, has had more than 150 different combinations of his name, occupation, employer and address listed at one time or another.
Most researchers and journalists now resort to time-consuming, error-prone, one-off, brute force methods to merge variations and clean data for analysis.
We need a better way, and it must be automated. We need an algorithm or machine-learning routine that can identify likely variations, allow for the input of human decision making, and automatically reapply judgements across a large data set that updates daily.
Download a list of 1.9 million unique names extracted from the state database. See what you can do.
Challenge #2: Identify a relevant state law or past corruption scandal, develop an algorithm to detect it

Campaign finance data is used routinely by journalists and regulators to document evidence of corruption in the political process. But the tip typically comes from a human source and is then pinned down piecemeal using public records. The findings are almost always narrow and limited to a single person or group.
We want to know: Could corruption be discovered faster, sooner and more broadly with well-tailored algorithmic analysis?
Past scandals can serve as a useful model. Could the evidence in the following cases been discovered by a well crafted database query, which could then be used to uncover other unknown cases?
- Millions of dollars in “dark money” funneled into ballot measures, like those concealed in 2012 by the notorious Sean Noble.
- Illegal laundering of campaign contributors via party committees in 2008 by state Sen. Tom Berryhill.
- Embarrassing use of campaign funds for luxury travel and spending by former Speaker Fabian Nunez and current state Sen. Isadore Hall III.
Download this list of 2.5 million campaign expenditures. Can you find the lavish spending of Nunez and Hall? Is there a pattern in their paper trail that can be detected automatically?
Challenge #3: Reconcile officeholders with a canonical identifier

The state database does not include a unique identifier that allows the campaign activity of officeholders to be connected to other valuable datasets, like voting records, ideological ratings and financial disclosure forms.
It also lacks basic metadata about officials such as age, gender and race. And state officials have withheld crucial data that would make connecting the dots easier.
But thanks to valuable code contributions at a recent hackathon, we have extracted a short list of the most important campaign filers.
Your task is to try to reconcile that list with the “Open States” identifiers developed by the Sunlight Foundation. Then our data can be linked to other sources that use Sunlight’s system.
Challenge #4: Propose a network model or statistic for meaningful analysis of relationships

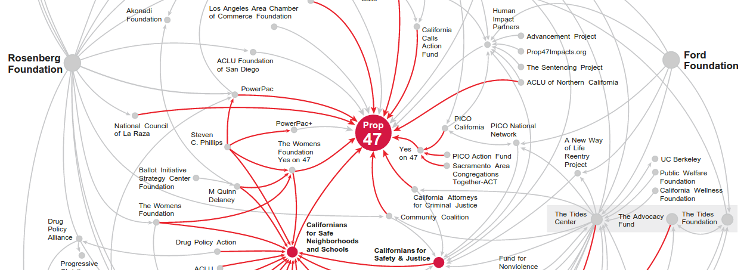
With thousands of donors and complex coalitions, political movements are difficult to map and understand. We need better tools for probing the immense amount of network connections recorded in campaign finance and lobbying data.
Carefully connecting dots has shown how creative accounting can conceal organized efforts behind high-stakes ballot measures and what really decides important appointments. But few comprehensive indicators exist for routinely mapping the political landscape to visualize its shape.
Draft a schema for modeling the network connections between parties, PACs, candidates, lobbyists, donors and expenditures in the state database, or propose a new statistic, like the Bedfellows score developed by The New York Times, to measure and understand these relationships.